This is a migration guide for TensorFlow users that already know how neural networks work and what a tensor is. I have been using TensorFlow since 2016, but I switched to PyTorch in 2020. Although the key concepts of both frameworks are pretty similar, especially since TF v2, I wanted to make sure that I use PyTorch's API properly and don't overlook some critical difference. Therefore, I read through the currently listed beginner-level PyTorch tutorials, the 14 notes in the PyTorch documentation (as of version 1.8.0), the top-level pages of the Python API like torch.Tensor
and torch.distributions
, and some intermediate tutorials. For each tutorial and documentation page, I list the insights that I consider relevant for TensorFlow users.
PyTorch for TensorFlow Users - A Minimal Diff
07 March 2021
Convolutions in Autoregressive Neural Networks
28 February 2019
This post explains how to use one-dimensional causal and dilated convolutions in autoregressive neural networks such as WaveNet. For implementation details, I will use the notation of the tensorflow.keras.layers
package, although the concepts themselves are framework-independent.
Say we have some temporal data, for example recordings of human speech. At a sample rate of 16,000 Hz, one second of recorded speech is a one-dimensional array of 16,000 values, as visualized here. Based on the recordings we have, we can compute a probabilistic model of the value at the next time step given the values at the previous time steps. Having a good model for this would be really helpful as it would allow us to generate speech ourselves.
A simple approach would be to model the next value using an affine transformation (linear combination + bias) of the four previous values. Implemented in Keras, this would be a single Dense
layer with units=1
:
Intuitive Explanation of the Gini Coefficient
10 October 2017
The Gini coefficient is a popular metric on Kaggle, especially for imbalanced class values. But googling "Gini coefficient" gives you mostly economic explanations. Here is a descriptive explanation with regard to using it as an evaluation metric in classification. The Jupyter Notebook for this post is here.
TL;DR: The Gini coefficients are the orange areas. The normalized Gini coefficient is the left one divided by the right one.

An Interactive Character-Level Language Model
19 February 2017 Source Code
I let a neural network read long texts one letter at a time. Its task was to predict the next letter based on those it had seen so far. Over time, it recognized patterns between letters. Find out what it learned by feeding it some letters below. When you click the send button on the right, it will read your text and auto-complete it.
You can choose between networks that read a lot of Wikipedia articles, US Congress transcripts etc.
Generate text from
|
||
...
|
Visualizing Travel Times with Multidimensional Scaling
13 January 2016


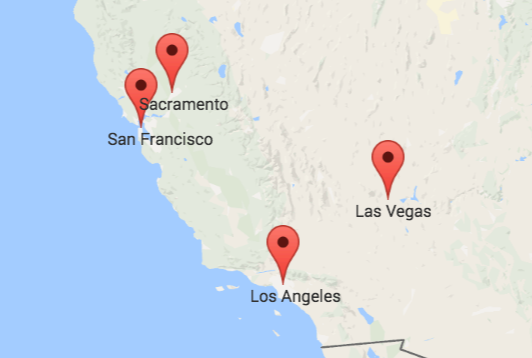
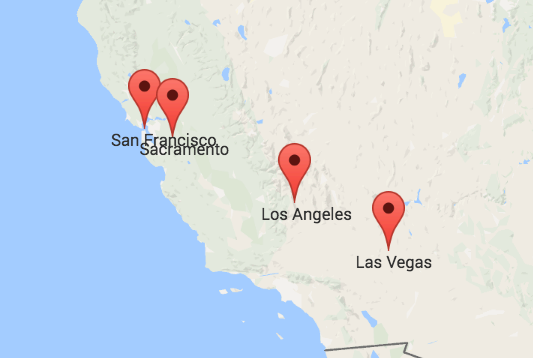
In a geography exam, the correct answer would be the left or upper one. It displays the actual locations of four cities in the US. But that does not make the other map entirely incorrect. It just displays other data. Specifically, it approximates the travel times between the four cities. This means that the closer two cities are on the right map the faster you can travel between them with public transport. We can calculate such maps using Multidimensional Scaling. What is Multidimensional Scaling? How can it help us to approximate travel times? And what is the relationship between the left map with the geographic locations and the right map? We are about to find out.
Read more